

Every AI initiative lands on somebody’s cloud, and the bill for that cloud just grew faster than it has in eight years. The big five hyperscalers in 2026 are Amazon Web Services, Microsoft Azure and Google Cloud, at 28, 20 and 15 percent of cloud infrastructure revenue, with Alibaba and Oracle contesting the last two seats. The shares are Synergy Research Group’s, for the second quarter of 2026, and they hide more movement than a stable podium suggests: the leader is slowly shrinking, third place is growing fastest, and the seats behind them are being rearranged by AI demand. This post walks the ranking as published, the vendors’ own Q2 numbers, and what a revenue share can and cannot tell a buyer.
How the ranking was built
The metric is one number from one source: each provider’s share of worldwide enterprise spending on cloud infrastructure services, as published by Synergy Research Group on 30 July 2026 for the quarter ending June 2026. Synergy counts IaaS, PaaS and hosted private cloud together, and puts the quarter at $143.4 billion, with trailing twelve-month revenues reaching $500 billion. Growth hit 43 percent year over year, the highest in eight years, and the release notes the market has doubled in size over the last eleven quarters. The cause is not subtle. Synergy’s chief analyst John Dinsdale says “AI technology has lit a fire under the cloud market and is now driving unprecedented growth”, and the release puts GenAI-specific cloud services at 165 percent growth year over year. A ranking built on this metric measures where enterprise infrastructure money goes, nothing else; the gaps in what it measures get their own section below.
Who are the big 5 hyperscalers?
The name comes from hyperscale computing, architecture that keeps scaling as demand is added, and the roster is less settled than the question implies: Red Hat’s definition notes there is “no universal standard for what should be classified as a hyperscaler” and lists AWS, Google Cloud, Microsoft Azure, IBM Cloud and Alibaba Cloud as fitting the description. Ranked on infrastructure revenue, the five that matter in 2026 are AWS, Microsoft Azure, Google Cloud, Alibaba Cloud and Oracle, the last two close enough that the order depends on the quarter you ask in. The scale behind the word is physical: Synergy’s hyperscale data center census counted 1,360 hyperscale data centers at the end of 2025, holding 48 percent of all worldwide data center capacity, with almost 800 more in the known pipeline and a projected 67 percent of all capacity by 2031. Whoever wins the revenue ranking, the AI infrastructure buildout is concentrating into fewer, larger hands.
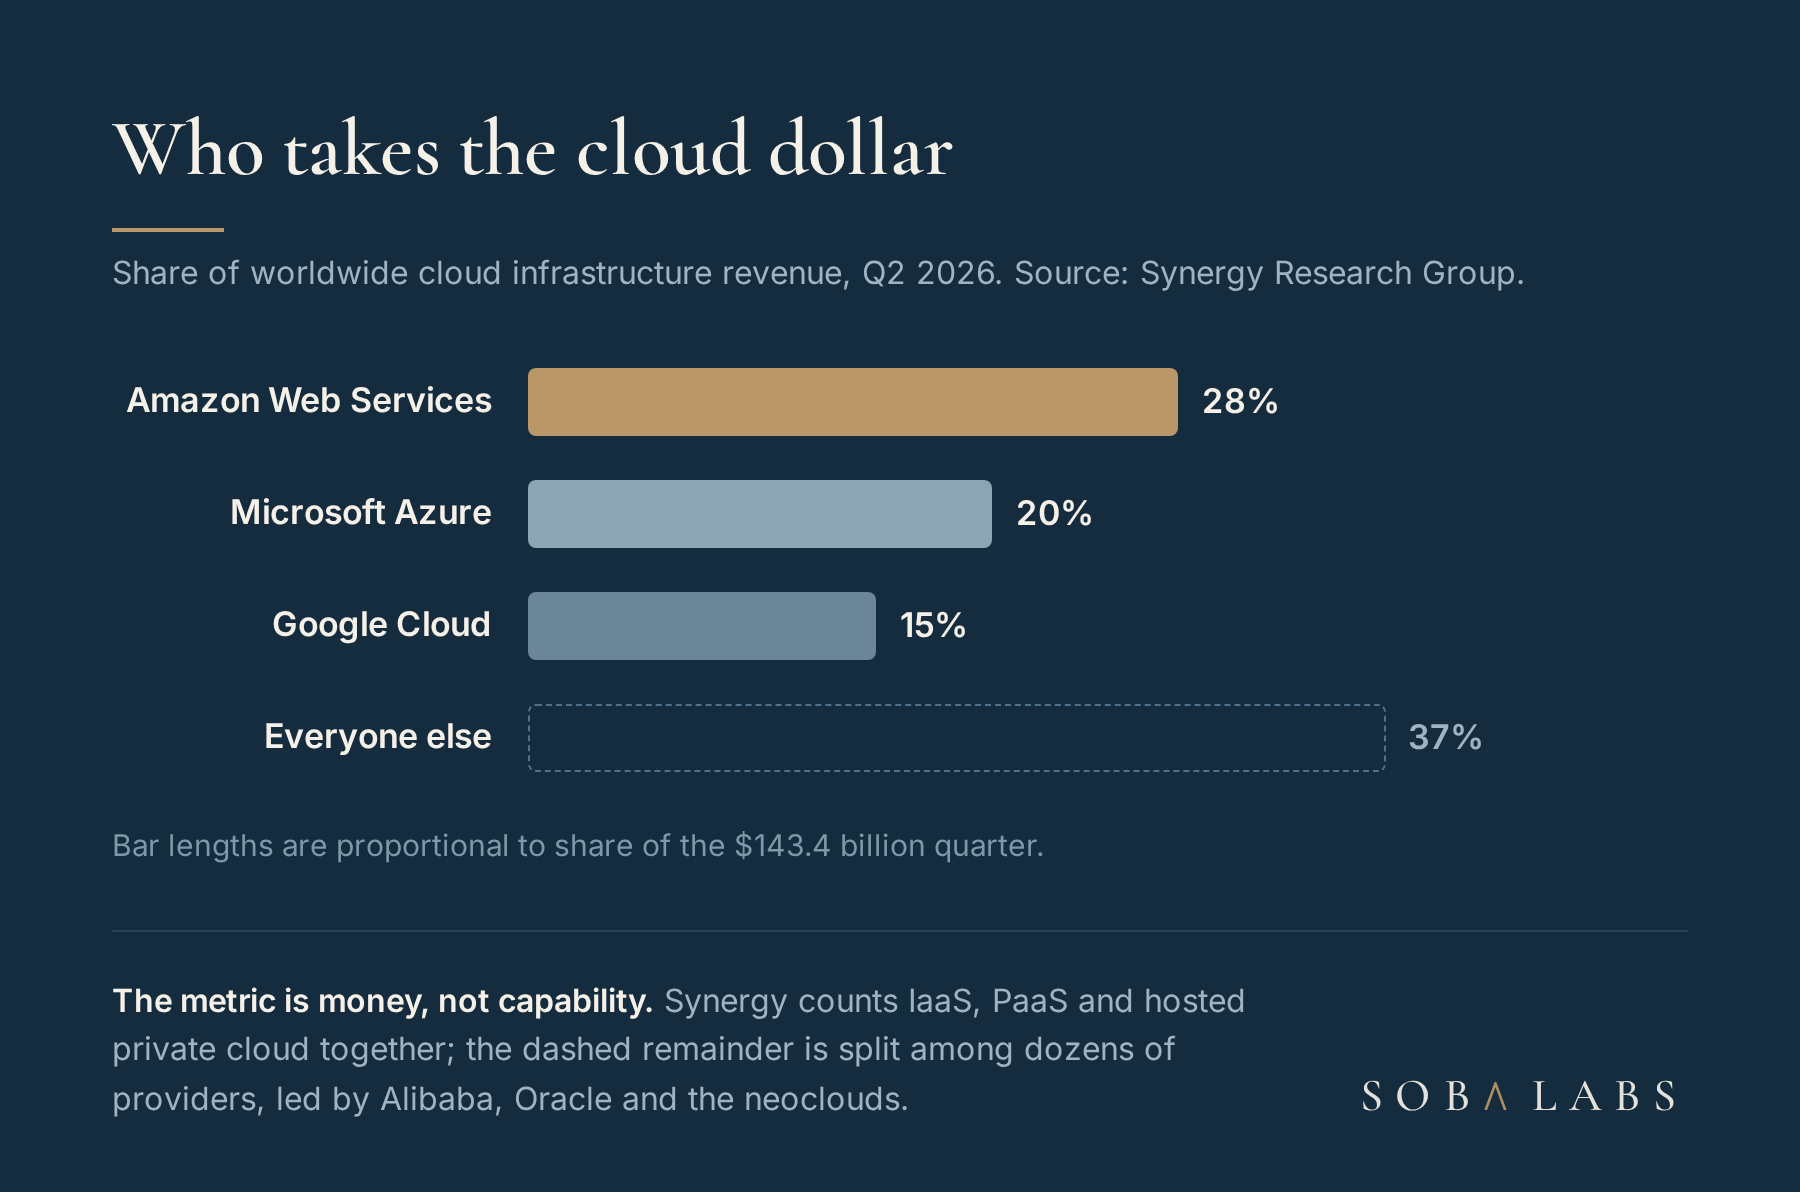
Amazon leads at 28 percent, and the lead is slowly eroding
AWS holds first place, but the share tells a quieter story than Amazon’s own Q2 release does. The release reports AWS segment sales up 37 percent year over year to $42.2 billion, its fastest growth in 18 quarters, a $169 billion annualized run rate, and segment operating income of $16.6 billion. Those are the numbers of a business growing hard. Synergy’s trend data adds the context: in its November 2025 share analysis, Amazon’s share had averaged just under 30 percent over the preceding four quarters, down from a little over 32 percent in 2021. At 28 percent in Q2 2026, the slide has continued. AWS is growing as fast as it has in years and still losing share, which is what a 43 percent market does to a 37 percent grower.
Microsoft and Google are converting AI demand into share
Second-placed Microsoft reported Intelligent Cloud revenue of $39.3 billion for the same quarter, up 32 percent, with Azure and other cloud services revenue up 43 percent. Microsoft publishes a growth rate rather than a quarterly Azure dollar figure, but its FY26 close put a yearly stake in the ground: CEO Satya Nadella said “Azure revenue surpassed $100 billion for the first time” in the fiscal year ended June 2026.
Third-placed Google Cloud is the acceleration story. Alphabet’s Q2 2026 release reports Google Cloud revenue up 82 percent to $24.8 billion, led by enterprise AI infrastructure and AI solutions on Google Cloud Platform, with segment operating income more than tripling from $2.8 billion to $8.8 billion. On Synergy’s shares, Google has moved from 13 percent in Q3 2025 to 15 percent in Q2 2026, closing on Azure’s 20. The pattern across the podium is one sentence: the AI buildout rewards whoever can stand up capacity fastest, and right now that reorders the cloud market from the bottom of the podium up. Each of the three sells that capacity through its own front door: Amazon Bedrock, Azure AI Foundry and Google Vertex AI are the same bet wearing three logos.
Fourth and fifth place are where the ranking gets argued
Synergy’s Q2 2026 release names shares only for the top three. Its most recent placing of the rest, from the November 2025 analysis, says “third-placed Google remains nearly four times the size of fourth-placed Alibaba, underscoring the widening gulf between the market leaders and the rest of the field.” Alibaba Cloud’s AI business is not standing still: its June quarter 2026 results report the AI Cloud and Compute Services segment, formed by combining Cloud Intelligence Group and the T-Head chip unit, at RMB 48.4 billion, about $7.1 billion, with total and external revenue growth both accelerating to 45 percent and, in CEO Eddie Wu’s words, “AI-related product revenue delivering triple-digit growth for the twelfth consecutive quarter.” Whether a European mid-sized company should run on it is a different question, one we took apart in Can you use a Chinese AI model?
Oracle is the loudest claimant to fifth place, and on momentum alone would claim fourth. Its quarter ended August 2026 reports cloud infrastructure revenue up 121 percent to $7.4 billion, total cloud revenue of $11.6 billion, more than $30 billion of new AI cloud contracts booked in the quarter, and remaining performance obligations of $664 billion. Note the offset quarter: Oracle’s figure covers June through August, so it never lines up exactly with the calendar Q2 shares above. Behind both, Synergy counts nine neocloud companies, GPU-first infrastructure providers led by CoreWeave, already among the top 40 cloud providers, with OpenAI and Anthropic themselves on the fastest-growing list. The seats behind the podium are being bought with data centers, quarter by quarter.
The trap: a backlog is a promise to spend, not spending. Microsoft reports commercial remaining performance obligations of $678 billion and Oracle $664 billion, and both numbers grew faster than total revenue. They are demand signals for capacity years out, not market share today, and a ranking quietly flips if you swap one for the other.
What a revenue share does not measure
Synergy’s metric is honest about being a money meter. Four distortions matter before you quote it. The scopes differ: Synergy counts IaaS, PaaS and hosted private cloud, while the vendors’ own figures above each draw the line differently, so a vendor dollar number and a Synergy share never divide cleanly into each other. The reporting differs: Microsoft gives no quarterly Azure dollar figure and Oracle’s fiscal quarter is offset by two months. The metric ignores capability: share of infrastructure revenue says nothing about which frontier models run where, and the busiest model traffic flows through doors this table cannot see, as our ranking of the most used AI models showed from OpenRouter’s data. And it ignores jurisdiction: a share ranking is worldwide, while a European buyer’s real constraints are data residency and, increasingly, sovereign AI requirements that can rule out a leader regardless of its share.
How a mid-sized buyer should use this ranking
For a CEO or CTO of a mid-sized company, the table answers one question well: where the market has already placed its infrastructure bet, and therefore where talent, tooling and second opinions will be easiest to find. Three uses survive the caveats:
- Default to the podium, deliberately. The big three hold 63 percent of the market between them (the three shares sum to it), and boring is a feature in infrastructure. The real decision is the exit: vendor lock-in costs are set on the way in, not the way out.
- Separate the model question from the cloud question. You can run on one cloud and buy models anywhere: through the cloud’s own platform, directly from the labs, or via an inference provider serving open-weight models as hosted inference. We practice what we preach here: Soba Labs runs no GPUs at all, our agent systems buy frontier models as metered APIs, and our infrastructure is a static site on a CDN edge. A company our size needs a workload map, not a hyperscaler strategy.
- Watch the spend meter from day one. A 43 percent growth market is a market of surprise invoices. The discipline has a name, AI FinOps, and it is cheaper to install before the first big AI workload than after the first big bill.
The takeaway
The big five hyperscalers in 2026 are AWS at 28 percent of cloud infrastructure revenue, Microsoft Azure at 20, Google Cloud at 15, and Alibaba and Oracle fighting for the last two seats of a $143.4 billion quarter growing 43 percent a year. The podium is stable, the forces under it are not: the leader is slowly ceding share, the fastest growth sits in third place and below, and AI demand is funding challengers, from Oracle’s 121 percent infrastructure growth to the neoclouds, that did not matter two years ago. Treat the ranking as a map of gravity, not a verdict. The model decision is separate from the cloud decision, and any share number you repeat deserves its date beside it, because this table is being redrawn quarterly.
Sources
- Q2 cloud market passes $143 billion, Synergy Research Group: the Q2 2026 market size, growth rate and the big three’s shares, published 30 July 2026.
- Cloud market share trends, Synergy Research Group: the November 2025 trend analysis, Amazon’s share history, Alibaba’s fourth place and the neoclouds.
- Hyperscale operators to account for 67% of all data center capacity by 2031, Synergy Research Group: the hyperscale data center count and capacity projections.
- Amazon Q2 2026 results, SEC filing: AWS revenue, growth and operating income.
- Microsoft FY26 Q4 press release: Intelligent Cloud revenue, Azure growth and the $100 billion Azure year.
- Alphabet Q2 2026 earnings release: Google Cloud revenue, growth and operating income.
- Oracle Q1 FY27 earnings release: OCI growth, cloud revenue, AI contract bookings and RPO.
- Alibaba Group June quarter 2026 results, SEC filing: AI Cloud and Compute Services revenue and growth.
- What is a hyperscaler?, Red Hat: the definition and the no-universal-standard caveat.